2 R Practical 2: mapping house price variation in Sheffield
To do this practical, you will need to install the
leaflet package. Before you do anything else, start RStudio
and run the command
install.packages("leaflet")2.1 Introduction
The spreadsheet house.csv, available on Blackboard, contains data on house prices, for each house sold in Sheffield in 2016, for the postcode districts S1 to S11. Each row corresponds to one house sale. Download the file from Blackboard onto your computer. Open this file in Excel to inspect the data.
The columns are as follows.
-price: the price paid (in pounds) for the house;
-Postcode: the postcode of the house;
-Latitude and Longitude: the geographical coordinates of the postcode;
-district: the postcode district of the house (the first letter and number of the full postcode).
Your main task is to investigate how house prices vary geographically.
2.2 Tasks
- From the previous practical, you should already have a folder for this module on your computer (or U: drive). Inside that folder, create another folder:
Practical 2.
- Download the files
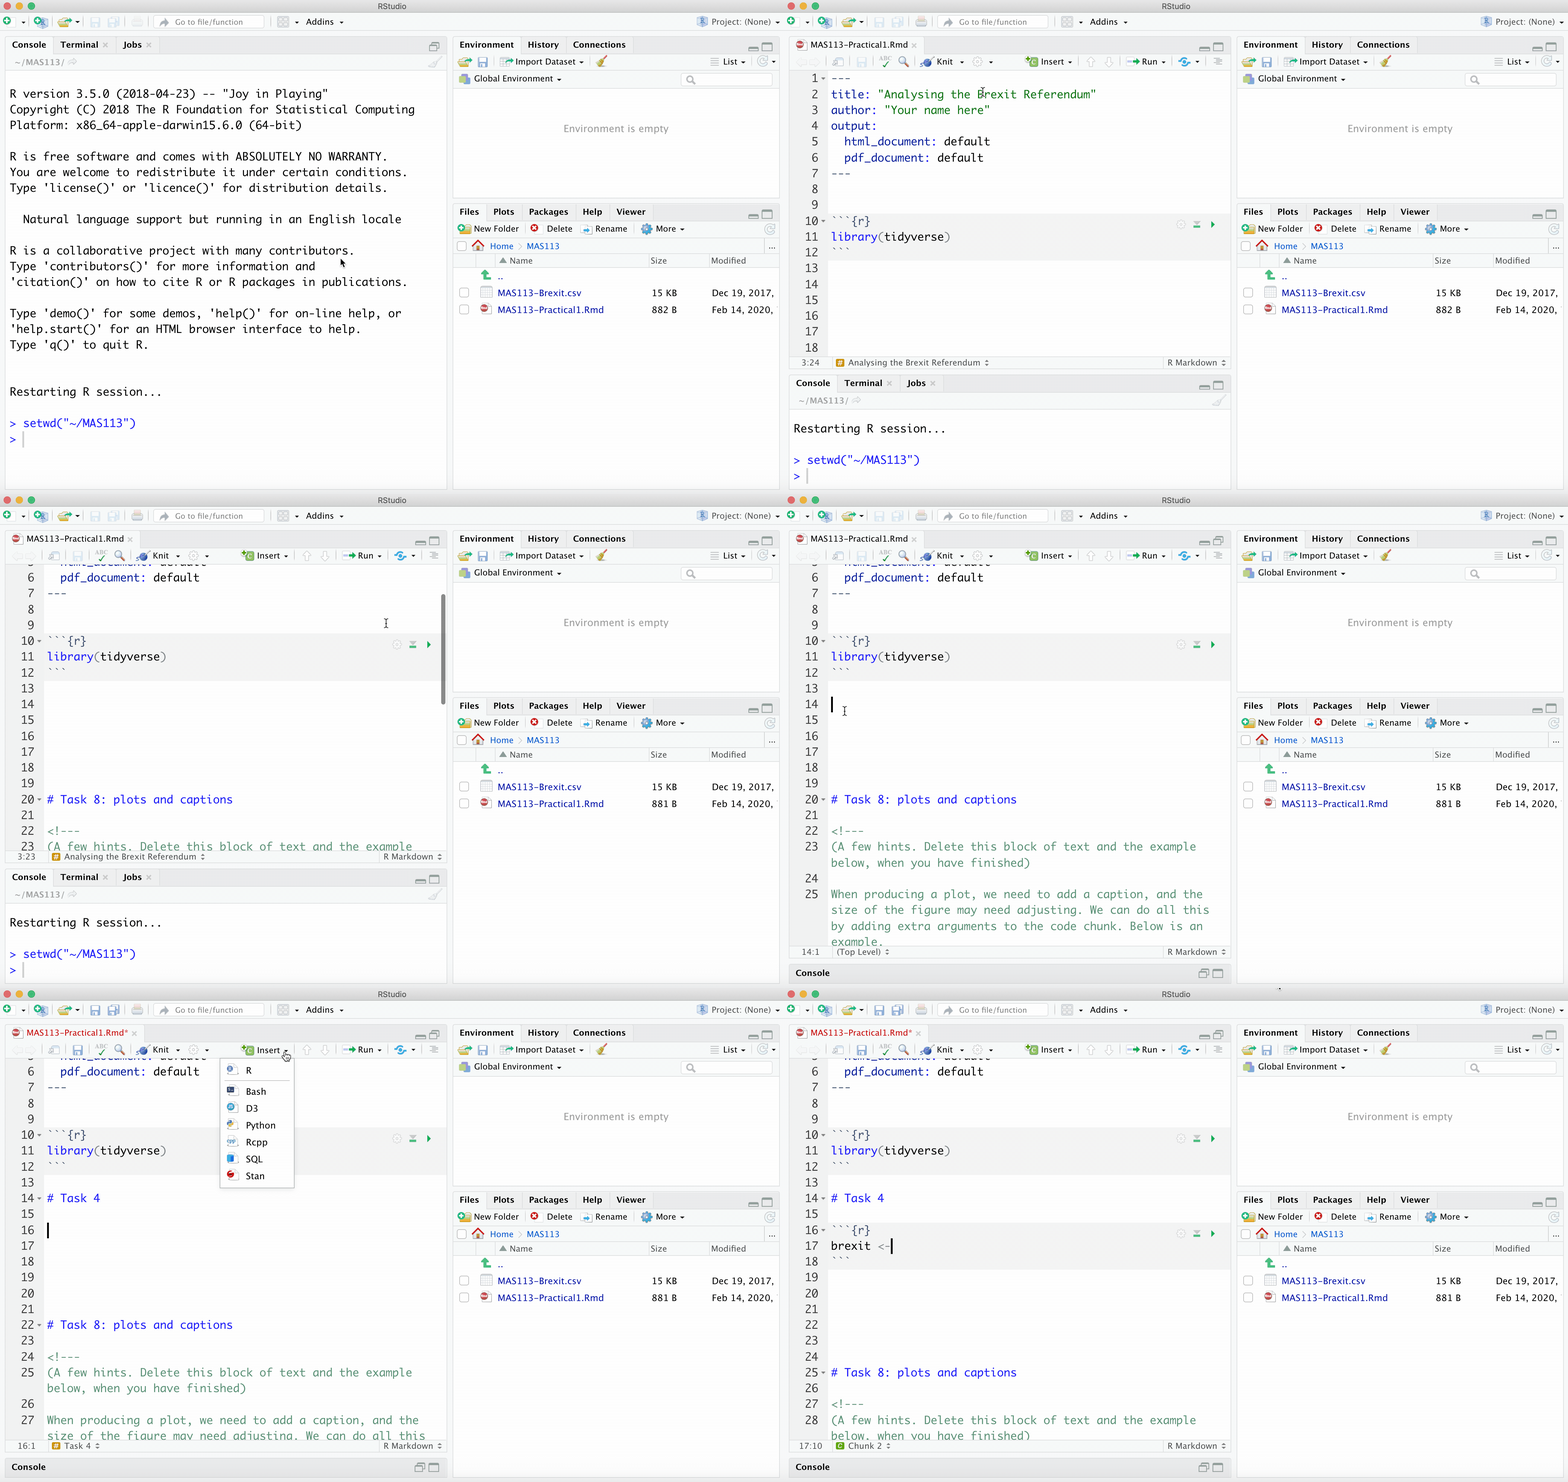
house.csvandPractical2.Rmdfrom Blackboard, and put them into yourPractical 2folder. Open the filehouse.csvin Excel to inspect it. Once the installation of theleafletpackage has finished, open the rmarkdown documentPractical2.Rmdin RStudio. Put your solutions to the following tasks in this rmarkdown document.
(This animation is from R Practical 1, but you need to do the same sort of thing here. Change the title at the top, as well as the author name.)

- Import the data into R, storing it as a data frame called
house. Inspect the first ten rows. Check these against the file in Excel, to make sure the data have been imported correctly.
You need to import your data by using a suitable command inside your .Rmd document. Do not import your data any other way.
- Copy and modify this lecture notes example: importing data
- Here, rather than
maths.csv, you are importing a file calledhouse.csv. - You need to store the result as
houserather thanmaths.
Use the
summarycommand to obtain some basic summary statistics of house prices.You should see a noticeable difference between the mean and median. From the output of the
summarycommand, what do you think has caused this?Which would be a better choice to indicate a `typical’ house price: the mean or the median?
- Here is an example of using the
summary()command. - Note that using this command involves extracting the values from a single column in your dataframe: a column called
pricefrom a dataframe calledhouse: here is an example, where we extract the values from a column calledscorefrom a dataframe calledmaths.
- Produce a suitable plot for displaying the distribution of all house prices. Specify a label for the \(x\)-axis so that the units are included. How would you describe the shape of this distribution?
Have a look at sections 1.6-1.8.1 in your notes.
- Produce a suitable plot to compare the distribution of house prices per postcode district. Which three districts appear to have the most variation in house prices?
Have a look at section 1.11 in your notes.
You will now investigate where the cheapest and most expensive houses tend to be.
- Find the 5th percentile and the 95th percentile of the house prices in the data set, and assign them to the variables
p05andp95. You will find the quantile() command helpful. - Follow the instructions in
Practical2.Rmdto produce a map of the most expensive and cheapest house prices. (You should be able to scroll and zoom on the map if you want.) - What do you notice? (Any ideas as to why?)
- Find the 5th percentile and the 95th percentile of the house prices in the data set, and assign them to the variables
2.3 Data sources
The house price data from this practical were obtained from (https://www.gov.uk/government/statistical-data-sets/price-paid-data-downloads)
Data produced by Land Registry (c) Crown copyright 2016.
The postcode coordinates data were obtained from (https://www.doogal.co.uk/AdministrativeAreas.php?district=E08000019)
Contains Ordnance Survey data (c) Crown copyright and database right 2017
Contains National Statistics data (c) Crown copyright and database right 2017
All data accessed 9/02/17.